Medical expenditures in Japan for FY2016 totaled 41.3 trillion yen (according to preliminary reports), approximately 0.2 trillion yen less than the total from the previous fiscal year. This preliminary figure is also referred to as approximate medical expenditure because it excludes expenditures stemming from work-related injuries or those paid entirely out of pocket by individuals. The growth rate of the approximate medical expenditure compared to the previous fiscal year was -0.4%. Rather than being frequently observed, this negative annual growth rate was an isolated occurrence, likely due to significant increases in expenses, particularly in 2015, related to antiviral drugs for treating viruses such as Hepatitis C, followed by a year in FY2016 that saw such changes as the revision of medical service fees as well as significant decreases in expenses for antiviral drugs.[1]
In this section, “medical expenditure” refers to the actual cost incurred at medical facilities for examinations, medications, and treatment for sickness or injury. Note that while “medical expenditure” refers to approximate medical expenditure, “national medical care expenditure” refers to the estimated costs of treating injuries and diseases covered by insurance. Specifically, “national medical care expenditure” includes costs for medical and dental treatment, pharmaceutical dispensing, hospital room and board, in-home nursing care, and treatments such as those from Judo therapists/acupuncturists.
As shown in Figure 7-1-1, national medical care expenditure increases every year. These national medical care expenditure figures represent estimates of the cost of treating injuries and illnesses at medical facilities within each fiscal year. Factors contributing to rising expenditures include those common among developed economies such as population aging, advances in medical technology, and increased demand for healthcare. In 2015, approximately 60% of national medical care expenditure was incurred by people aged 65 and over.[2] This group composed approximately 27.3% of the total population as of October 1, 2016. It is predicted that amidst a shrinking population, the rate of population aging will continue to rise, bringing the percent of people aged 65 or over to 33.3% or 1 in 3 by 2036 and resulting in even higher national medical expenditure.[3]
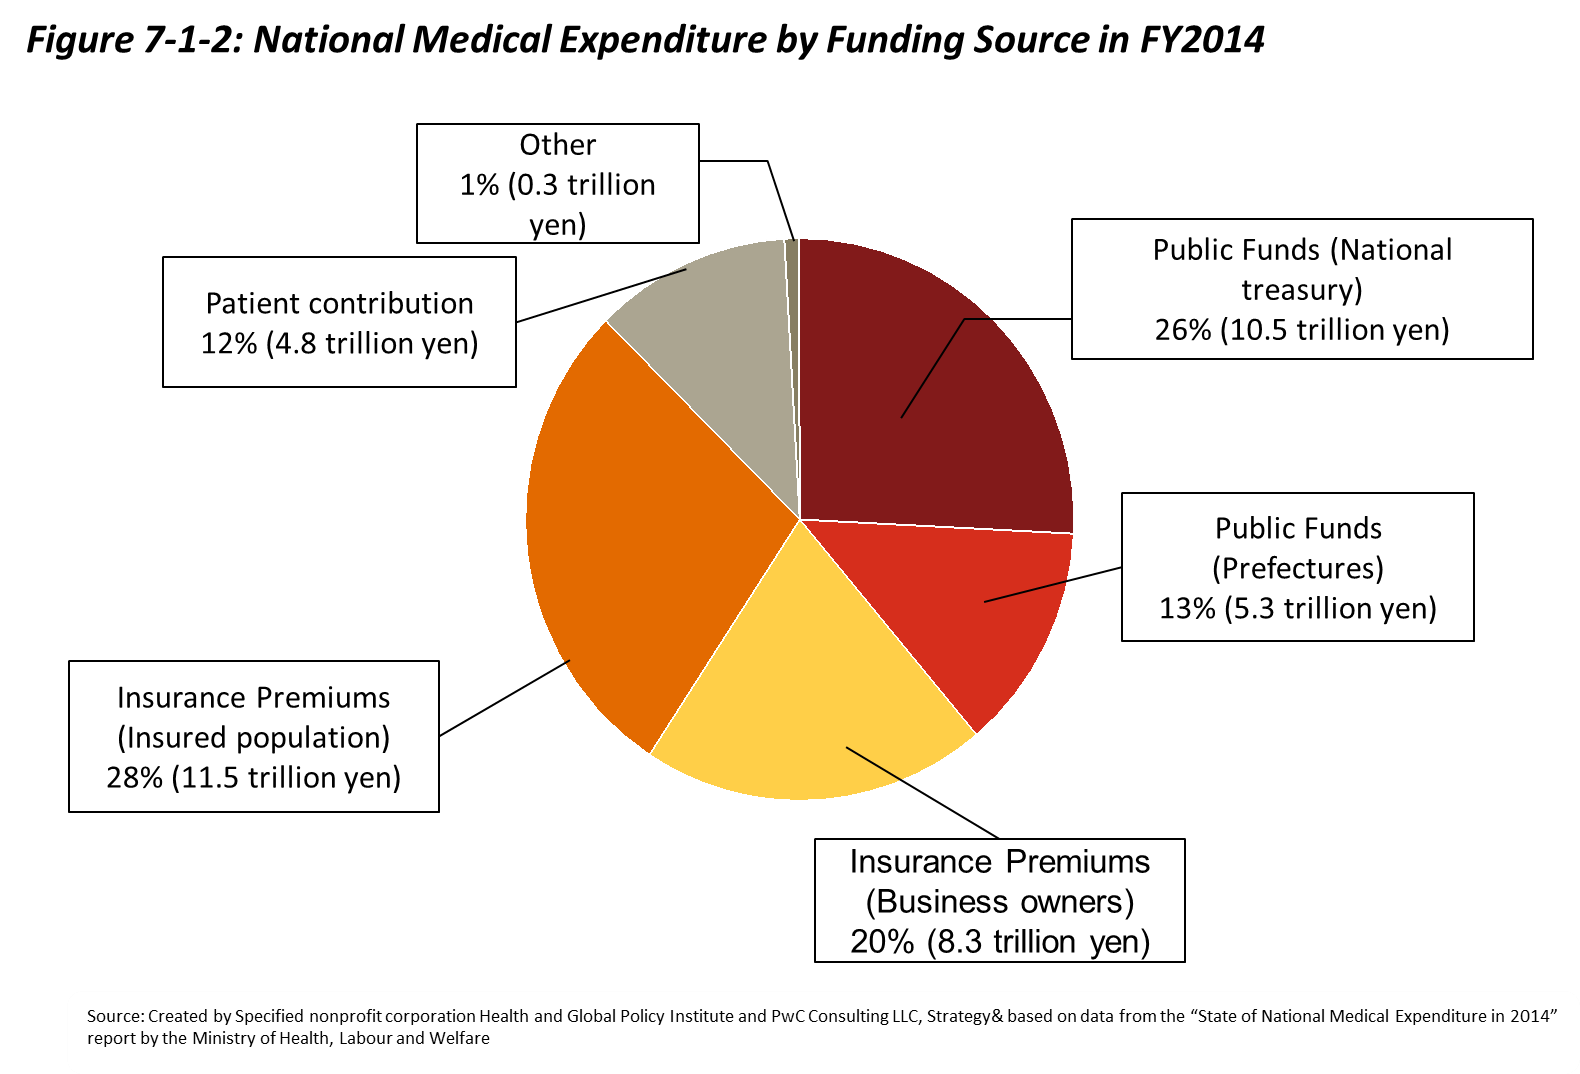
The topic of national medical care expenditure is crucial for considering the sustainability of Japan’s universal health insurance system. This is especially clear when viewing national medical care expenditure by funding source—a total of 87% of all expenditures are funded via public sources (government funds and insurance premiums). The complete breakdown of funding sources is shown in Figure 7-1-2.
Compared to other developed nations, Japan spends relatively little on healthcare in absolute terms; however, total spending on healthcare as a proportion of GDP is higher than the OECD average. By this measure, Japan ranks sixth, just behind the United States, Switzerland, Germany, Sweden, and France.[4] That said, it should be noted that the OECD calculates healthcare spending as the sum total of not only national medical care expenditures for treatments reimbursed by health insurance, but also spending on over-the-counter medications (OTCs), long-term nursing care, preventative measures (vaccinations, checkups, etc.), natural childbirth, and optional hospital bed upgrades.
In recent years, total healthcare spending as a proportion of GDP has been increasing. Starting in 2006 and heading into 2016, healthcare spending as a proportion of GDP increased from 7.8% to 10.9%, a number that far surpasses the 2016 OECD average of 9.0%.[5] Japan is one of only a small number of OECD member economies that has reported rising healthcare spending as a proportion of GDP since 2009. However, the OECD does predict that healthcare spending in Japan will gradually level off in the future.
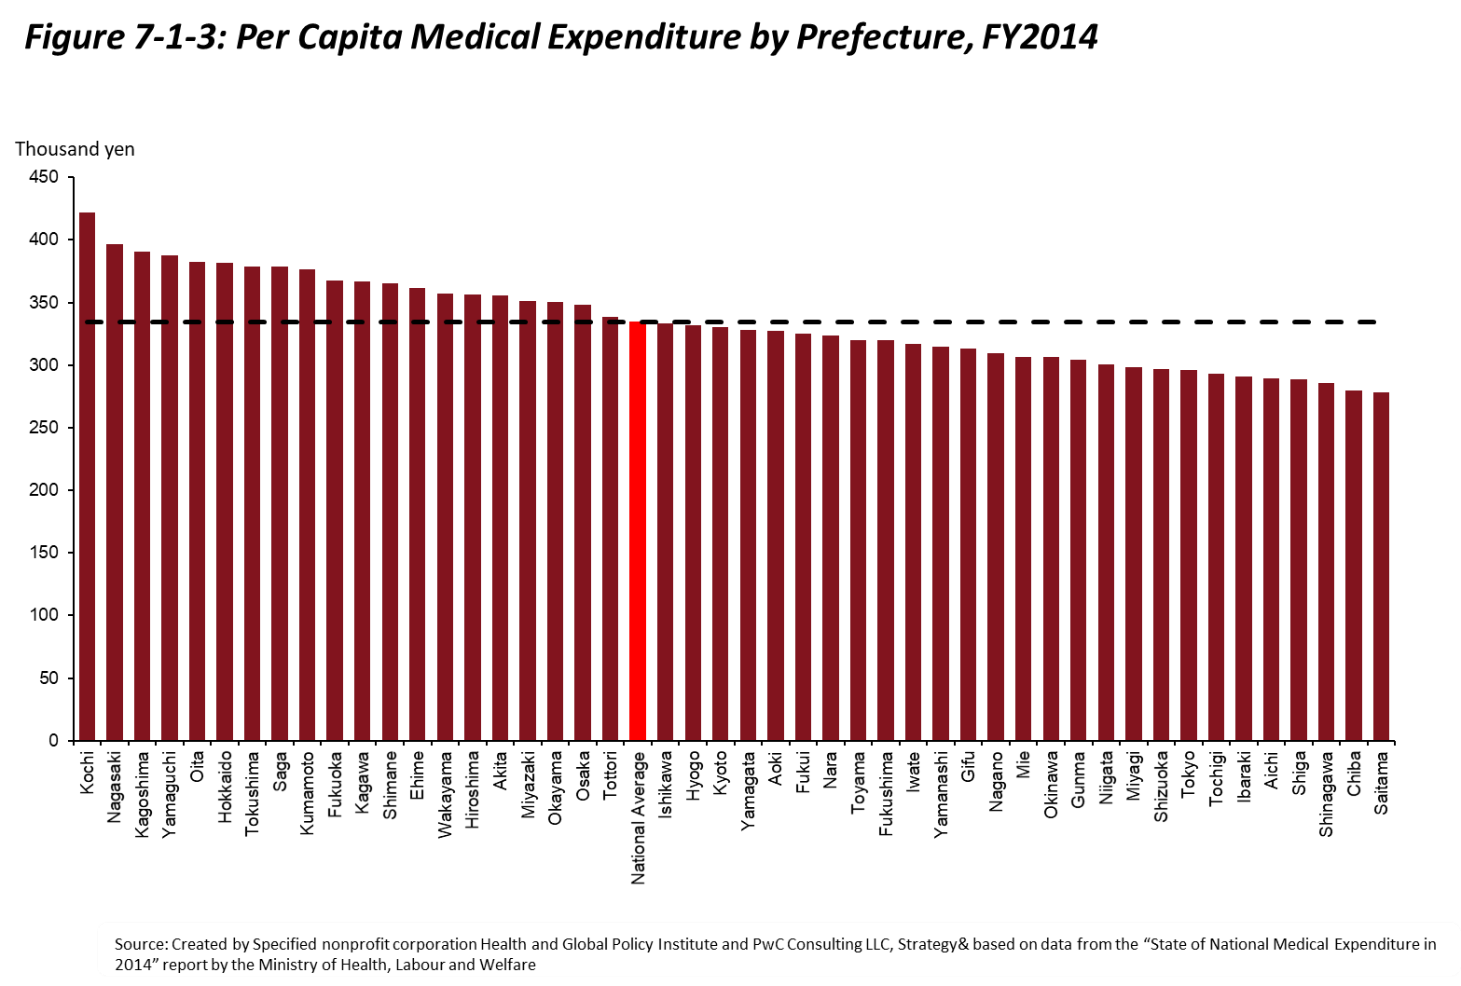
Japan faces regional disparities in national medical care expenditure. As shown in Figure 7-1-3, FY2014 medical care expenditure in Kochi Prefecture, the prefecture with the highest spending, was approximately 1.5 times higher than the expenditure of Saitama Prefecture, the prefecture which spent the least. The national government is currently aiming to reduce the age-adjusted per-capita national medical care expenditure gap by half in response to this issue. Regional Medical Care Visions, Medical Cost Optimization Plans, and the strengthening of incentive measures for health-promotion as discussed in Sections 4 and 5 are all parts of the effort being made to resolve this problem.
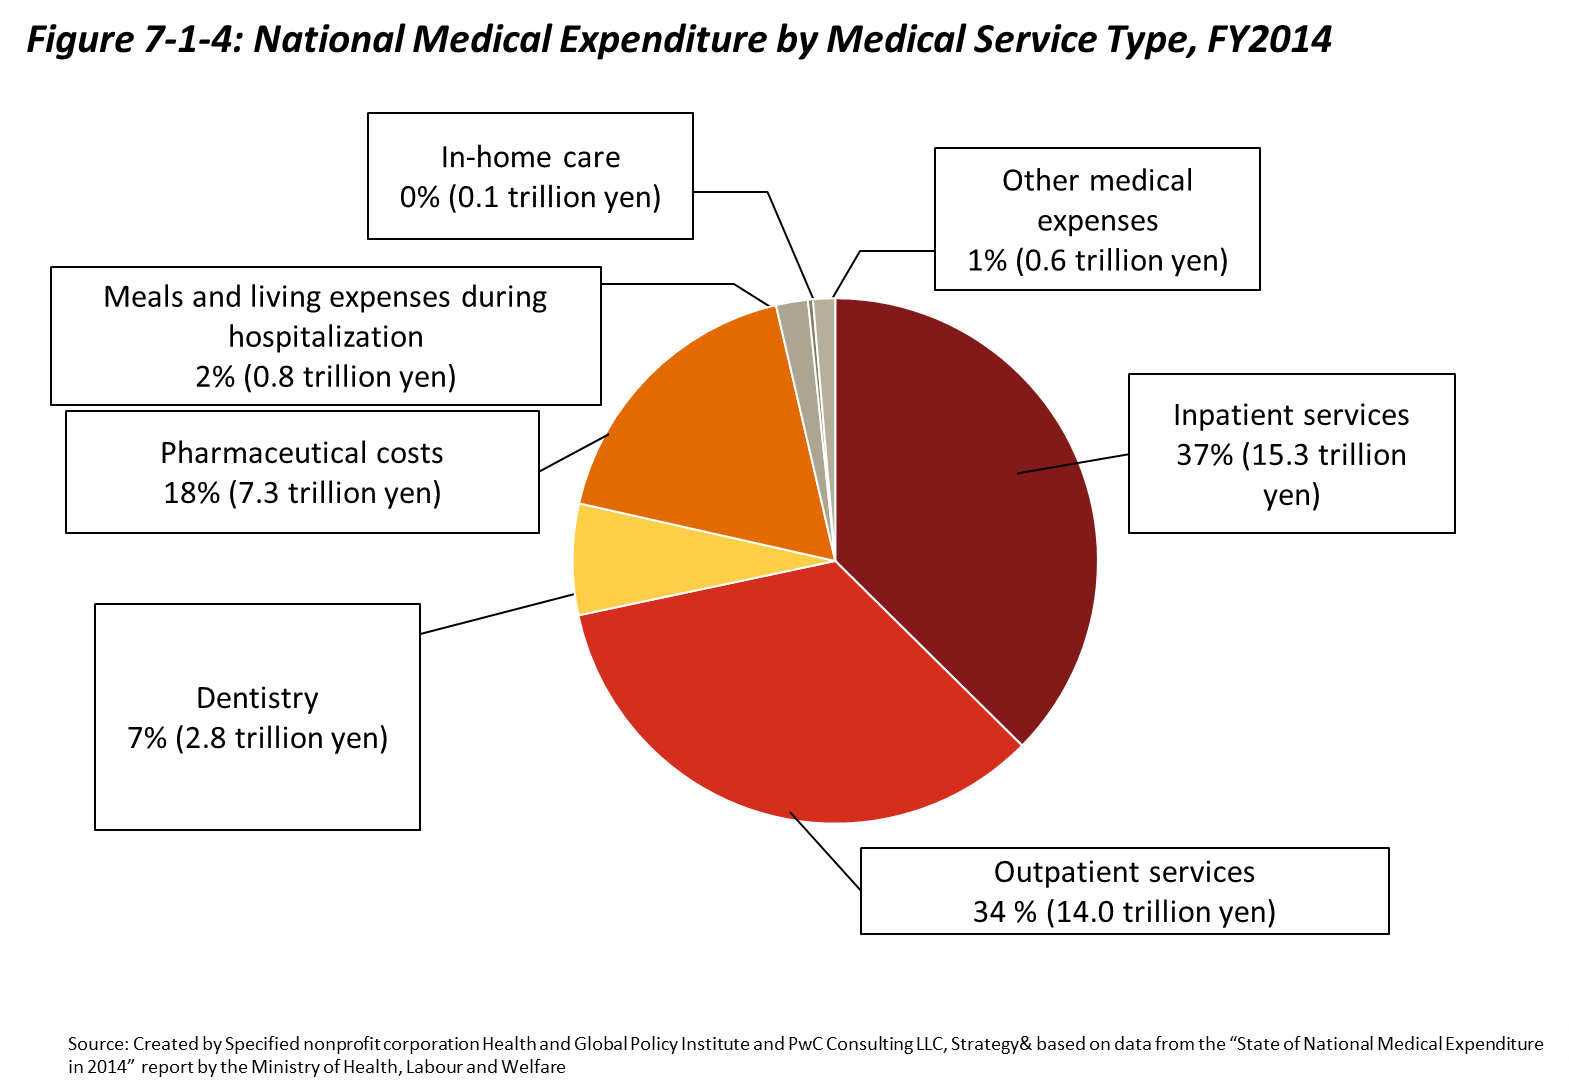
In terms of the ranking of national medical care expenditures by type of care, as shown in Figure 7-1-4, in FY2014 inpatient expenditures ranked highest, accounting for 37% of the total, followed by outpatient expenditures at 34%, and pharmacy dispensing expenditures at 18%. As touched upon in Section 4, one factor that has been identified behind the high inpatient expenditures is the longer than average length of hospitalization in Japan compared to other countries.


