Medical facility revenue is composed of the total remainder after subtracting patient copayments and claims paid by insurance examination and payment facilities. This revenue does not go only to physician salaries. It is also used to cover hospital and clinic overhead, as well as the cost of purchasing pharmaceuticals, the cost of purchasing medical supplies, and the cost of facility maintenance.
In this section, “medical expenditure” refers to the actual cost incurred at medical facilities for examinations, medications, and treatment for sickness or injury. Note that while “medical expenditure” refers to approximate medical expenditure, “national medical care expenditure” refers to the estimated costs of treating injuries and diseases covered by insurance. Specifically, “national medical care expenditure” includes costs for medical and dental treatment, pharmaceutical dispensing, hospital room and board, in-home nursing care, and treatments such as those from chiropractors/acupuncturists.
MHLW conducts a regular Survey on the Current State of Health Economics that examines the state of healthcare management at hospitals, medical clinics, dental clinics, and insurance-covered pharmacies. This survey is conducted every two years, and the results inform future medical service fee revisions.[11]
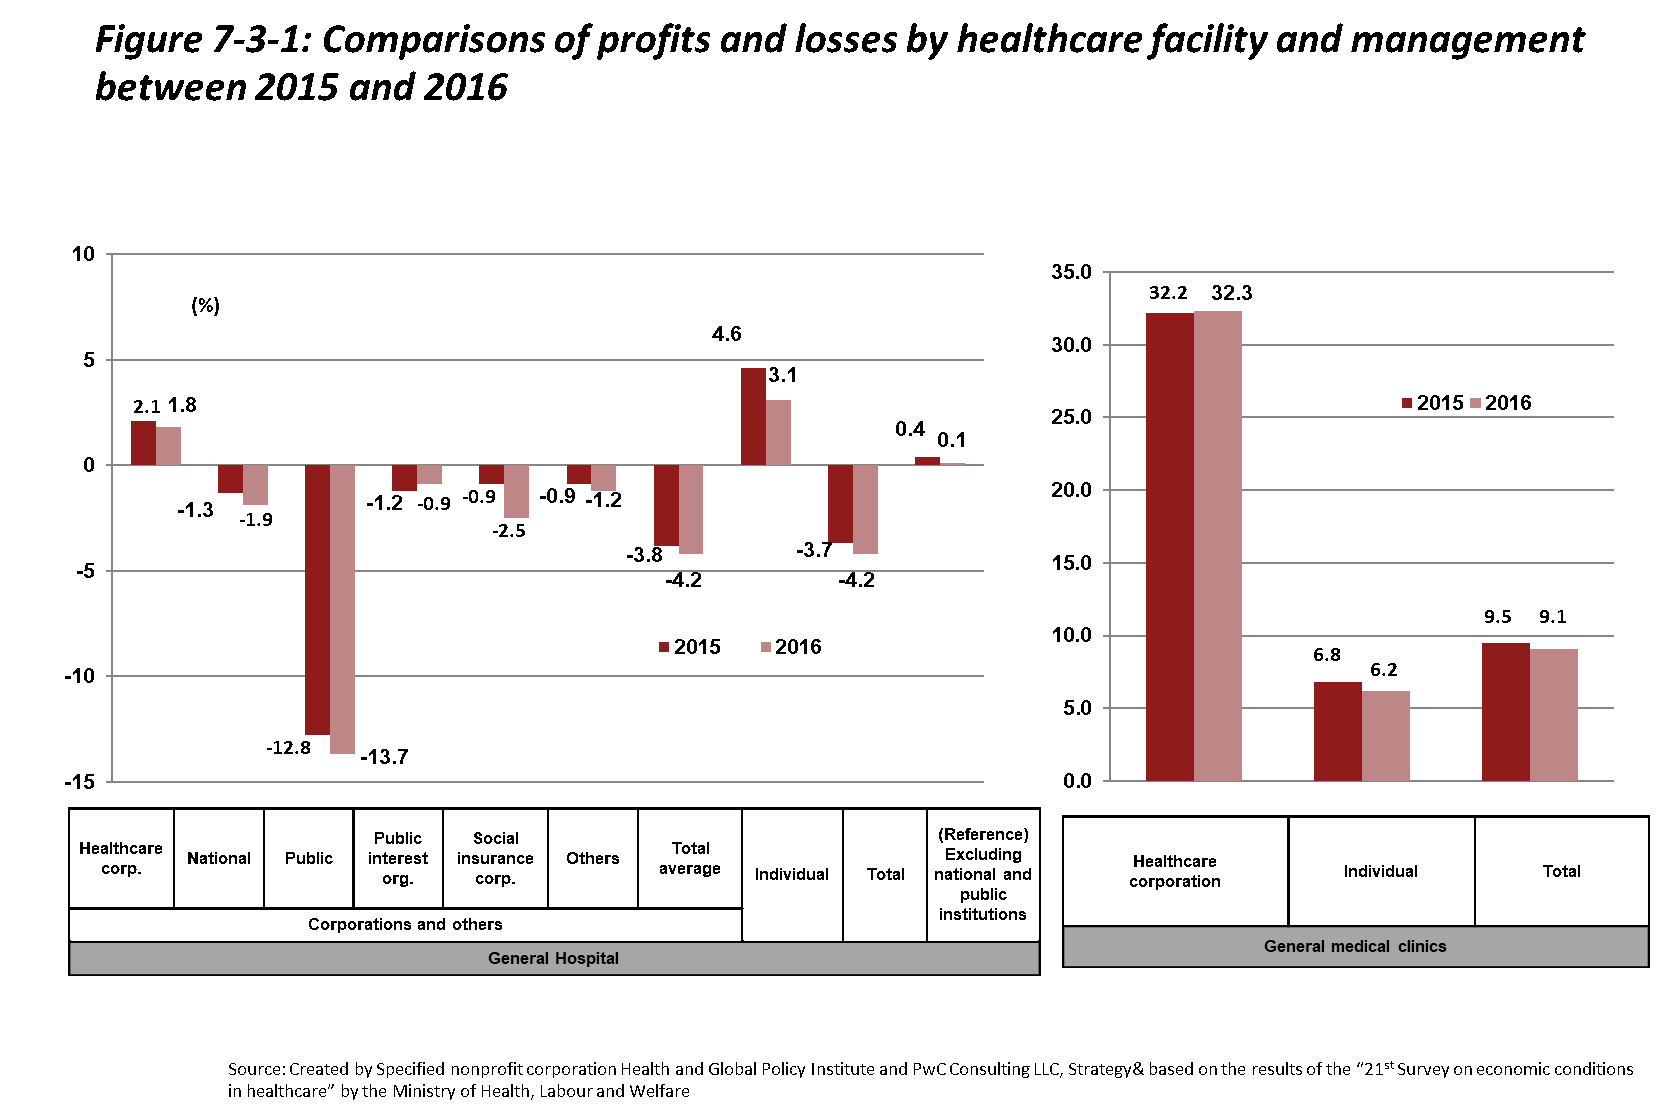
Figure 7-3-1 shows profits and losses in FY2015 and FY2016 by medical facility type. The profit margin in FY2016 for hospitals overall was -4.2%, although this figure jumps to +0.1% when excluding national public hospitals. This is thanks to the positive effect of the FY2014 medical service fee revision on most hospital profit margins (+0.4%→+0.6%). Many hospital types are losing money overall, with public hospital profit margins being particularly low.
Although most public hospitals are in debt, as these hospitals bear responsibility for pro bono care as well as most care in remote areas, a portion of their debts are subsidized by tax revenues. Reasons for the high amounts of debt among public hospitals include cost-related problems as well as shrinking patient numbers. Especially at smaller public hospitals, although average service prices are increasing, profits are decreasing due to falling patient numbers.[12]
In addition, salary rates, pharmaceutical costs, and depreciation expenses are higher at public hospitals compared to hospitals in general. In response to this situation, actions are being taken based on the “New Public Hospital Improvement Guidelines” including initiatives for the improvement of healthcare management, adjustments to hospital bed functions in consideration of regional healthcare needs, and downsizing.
Meanwhile, as in previous years, medical clinics remain profitable. That said, profit margins are shrinking. At the time of the last revision in FY2014, the clinic profit margin was 15.5%, but in FY2016, it was 9.1%.
It’s important to keep in mind that the facilities sampled for the Survey on the Current State of Health Economics vary between surveys, so it is not possible to directly compare recent survey results with past results. Furthermore, since the Survey is set to only a sampling of medical facilities, there is always the chance that results do not accurately reflect the true distribution of profit margins across Japan.
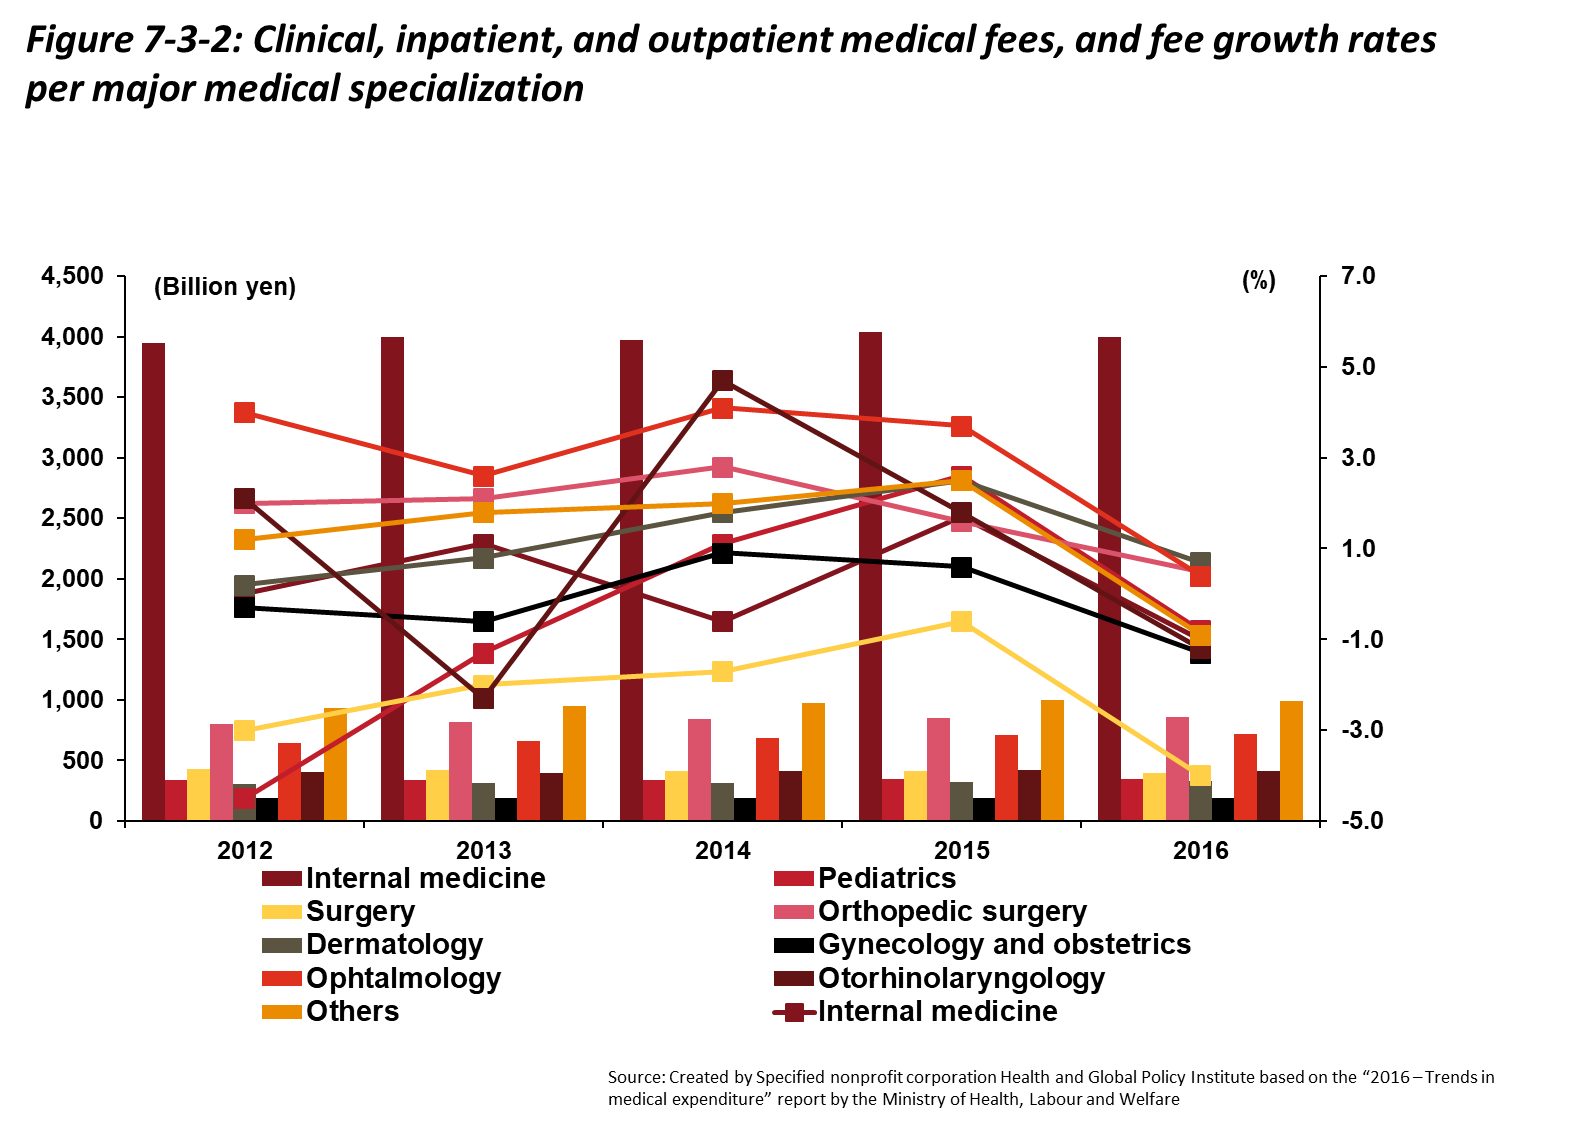
Figure 7-3-2 shows medical expenditures by specialty. Expenditures vary among specialties, with otolaryngology and otolaryngologic surgery expenditure trends differing most greatly from trends related to other specialties. Pediatrics, pediatric surgery, and obstetrics/gynecology have consistently shown negative growth rates. Internal medicine ranks highest in terms of total expenditures due to recent measures such as the promotion of primary care, and because this specialty treats the largest number of patients. In comparison, expenditures were more than four times lower for orthopedic surgery, the specialty with the second-highest expenditures.
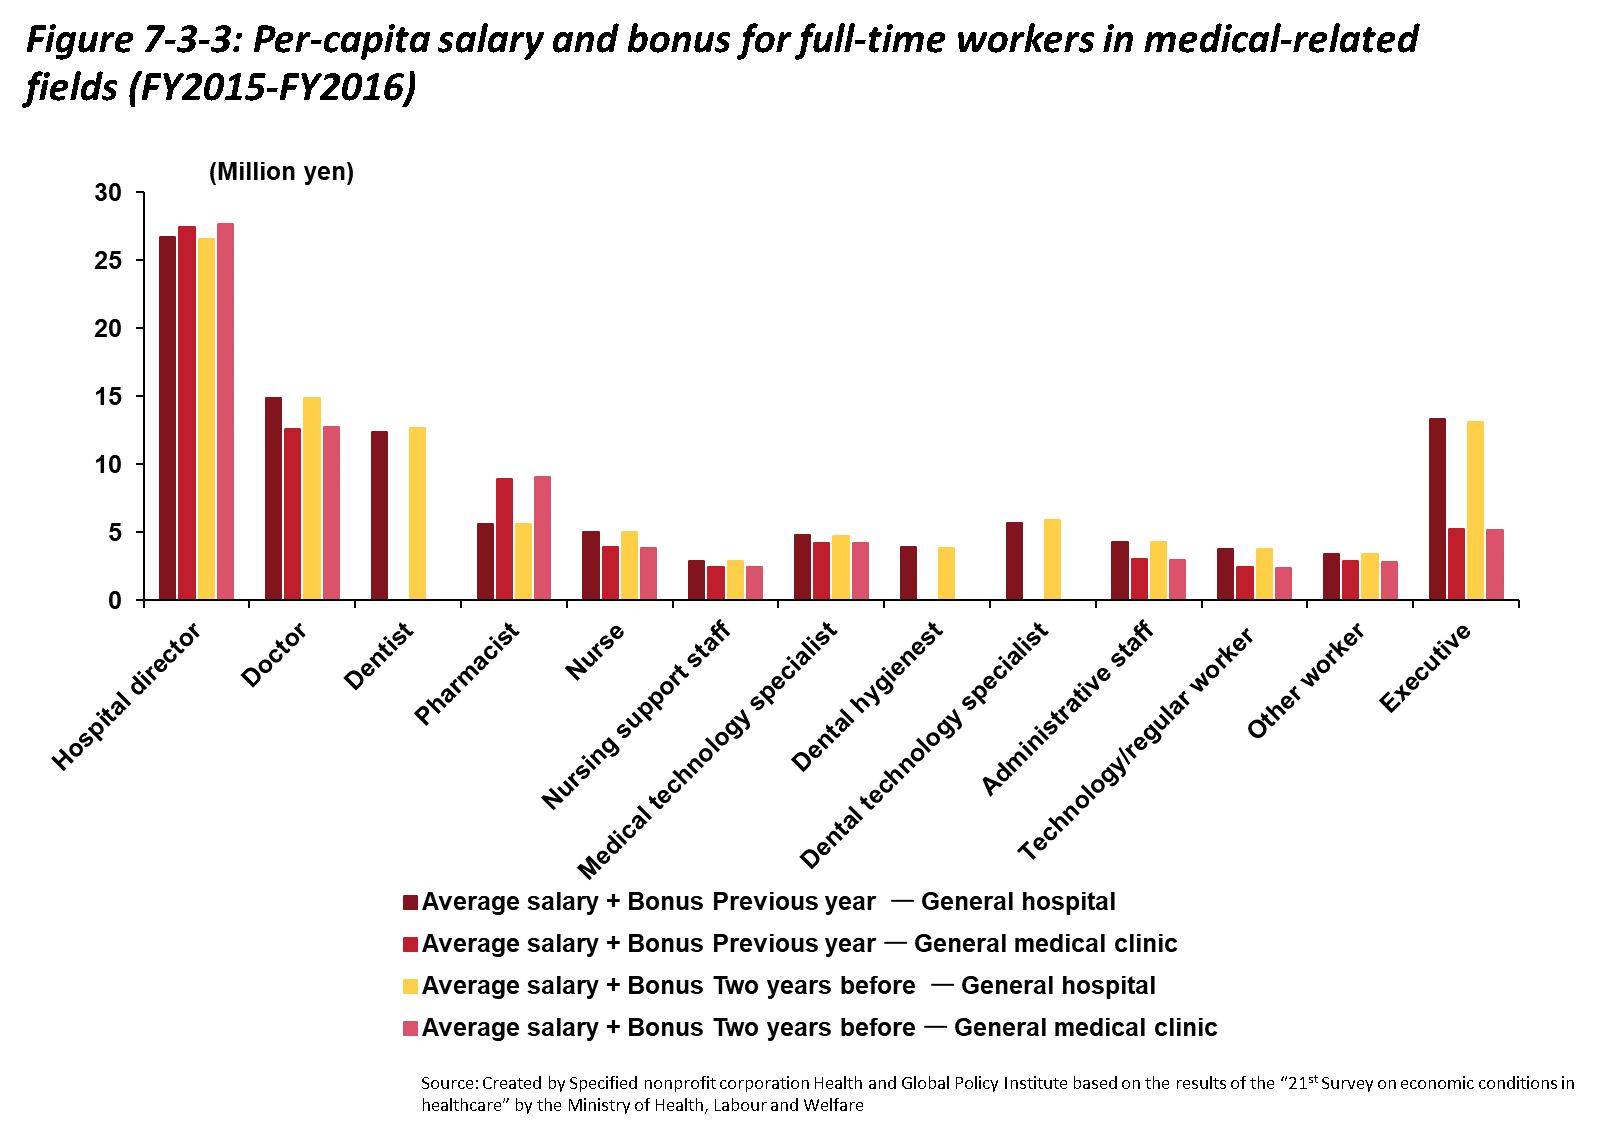
Looking at average remuneration (salaries and bonuses) for full-time employees working at medical facilities, as shown in Figure 7-3-3, totals are particularly high for hospital directors and physicians at both hospitals and medical clinics, especially compared to other full-time employees. Other than full-time pharmacists and executives, there are not large differences within professions depending on the facility type. This was true of hospitals and medical clinics in general even when comparing data from one fiscal year to the next.
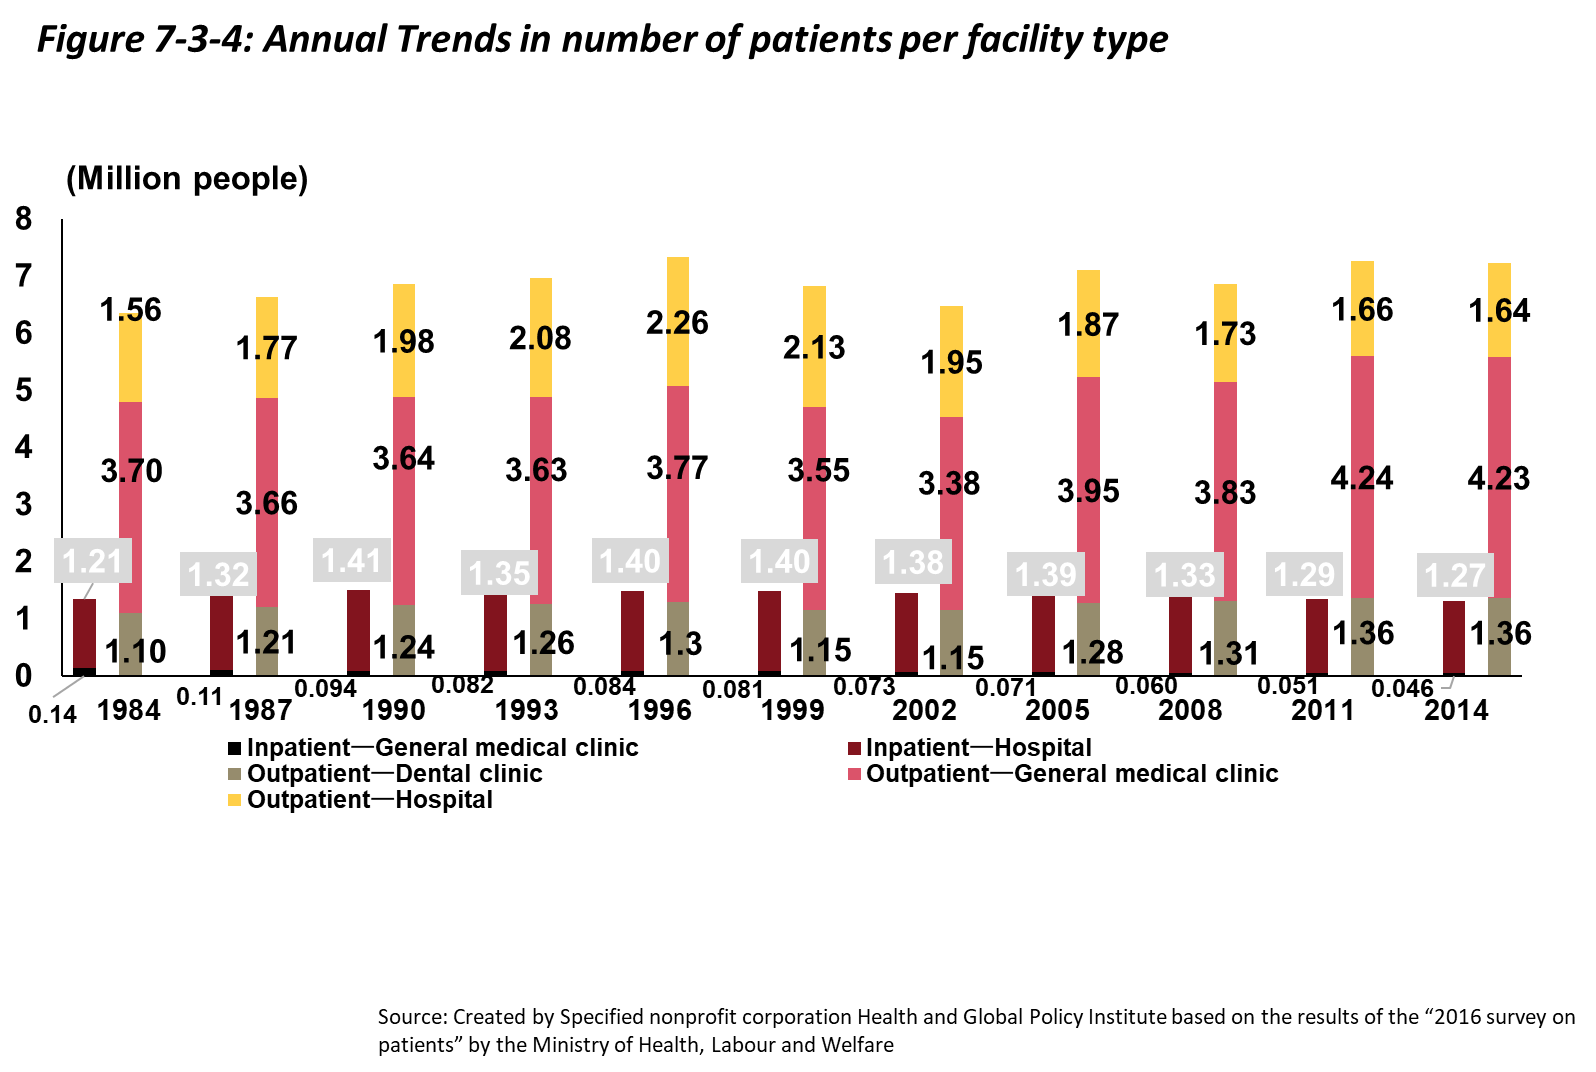
Looking at the annual trends in terms of estimated numbers of patients per facility type (as shown in Figure 7-3-4), outpatients exceed inpatients. This is to be expected since the incidence of serious diseases requiring hospitalization is low compared to that of diseases for which outpatient care is sufficient. Both inpatient and outpatient numbers increased slightly from 1984 to 1996, but thereafter the number of outpatients leveled off. Since 2011, the number of hospitalized patients has reached a level nearly equivalent to the level in 1984.