Health spending in Japan is generally considered low when compared to other advanced economies, yet costs exceed OECD averages in terms of public expenditures on health and pharmaceutical expenditures. In Japan, where public sources fund 83% of health spending, health expenditures have great implications for health care sustainability.1
Health Expenditures
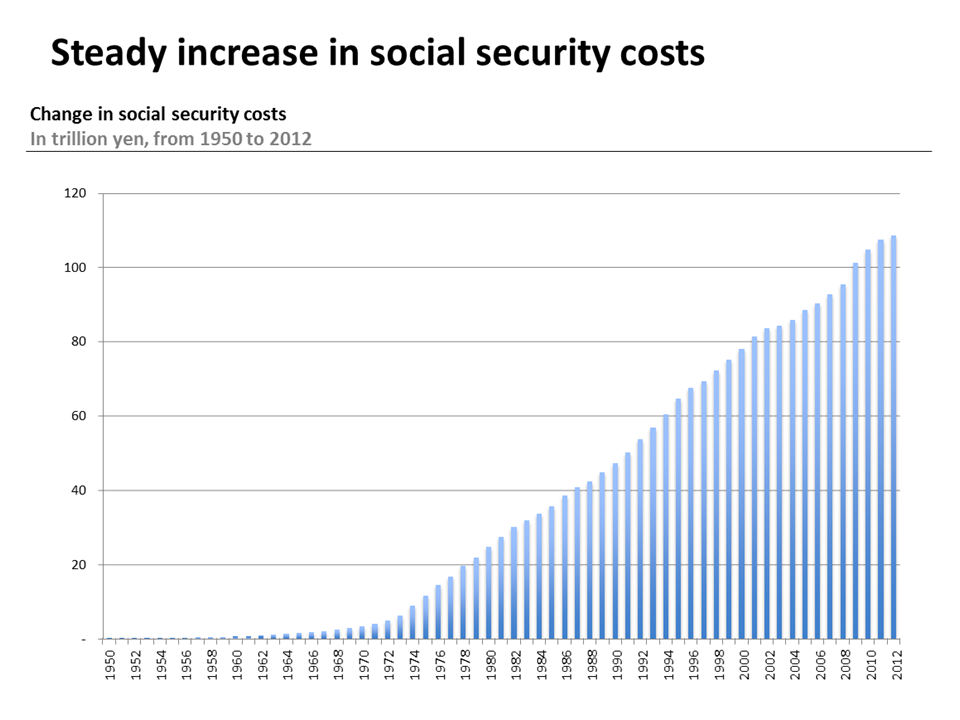
Source: Social Security Cost Figures, 2012
Expenditure overview
In recent years, total health expenditures (all money spent on medical goods and services) as a part of GDP has been on the rise in Japan. Between 2008 and 2013, health spending rose from 8.5% to 10.2% of GDP surpassing the 2013 OECD average of 8.9%.2 And while the OECD reports that health spending is expected to slowdown, Japan remains one of the few OECD countries where health spending to GDP has increased since 2009.3 Part of this increase is in part due slow economic growth. However, while public and private spending per capita continues to hover close to the OECD average, the annual average per capita health expenditure growth rate between 2009 and 2013 was well above the OECD average growth rate for the same years.4
Growth in expenditures
Similar to other advanced economies, growth in health expenditures can be attributed to increasing healthcare costs associated with population ageing as well as increasingly specialized and advanced medicine. For example, in 2011 64% of hospital expenditures were used to care for the 65 and older population, which comprised 23% of the total population in 2012.5 By 2020, the share of the 65 and older population is expected to reach 30% and health expenditures for this population is projected to increase to 66% of national health expenditures.6 Enrollment in health insurance for the oldest of the old increased by 3% between 2011 and 2012 and the number of long-term care benefit recipients increased by 5.5%, or 2.85 million people, between 2011 and 2012.
Pharmaceutical and medical device sector
Japan is one of the world’s largest medical device markets estimated in 2012 at $32 billion, an increase of 8.7 percent from 2011. The market size is expected to continue to grow given the ageing population.
Japan continues to see increased growth in pharmaceutical spending while other countries have seen a slowdown in recent years. Public spending on pharmaceuticals increased by 5% annually between 2009 and 2013 and, in 2013, per capita spending on pharmaceutical was second highest within the OECD.
One reason often attributed to high spending on pharmaceuticals is the low penetration of generics in the market. In 2013, generics comprised 11% of pharmaceutical market value compared to the OECD average of 24%. Japan also ranks low in terms of market volume of generics at 28% compared to the OECD average of 48%. In contrast, generics comprise over 80% of the pharmaceutical market in terms of volume in Germany, the UK, and the US.7
The Japanese government has been working for years to accelerate the use of generic drugs in Japan. In 2002, there were a few changes made to the fee schedule and prescription methods intended to increase use of generics drugs. However, the government’s intentions were unclear until the goal to increase pharmaceutical market volume share of generics to 30% was declared as a part of the Cabinet-led 2007 economic and fiscal reform legislation. The MHLW followed up later that year with the “Action Plan to Promote the Safe Use of Generics,” which set policies related to patient understanding of generics, generic drug quality, and dispensing of generic drugs. Between 2008 and 2012, various adjustments were made to the fee schedule and to prescription regulations to further encourage the use of generic drugs. In 2013, the MHLW released its new goal of increasing the share of generic in the market (where generic replacement is possible) from the 2010 figure of 40% to 60% by 2018 in its “Roadmap for Further Promotion of Generic Medicine Use” released that year. In addition to setting a new goal, this “roadmap” set policy to strengthen the system to monitor progress toward this goal and clearly identified actions to be taken by the government, industry, and health care providers in order to achieve this goal.8 In 2015, the government announced a new goal to bring generic drug use to over 80% (where generic replacement is possible).
Japan- The Best Market?
When executives of non-Japanese pharmaceutical companies and organizations come to Japan, they often are heard saying, “Japan is the best market!” One reason for this is because the health care system and administrative issues are highly predictable. In Japan, although pharmaceutical prices are revised one every two years, the market price and the extent of price revisions can be forecasted, in turn, making sales for the coming years relatively easy to predict. In addition, compared to the US and Europe, a greater sense of trust of pharmaceutical industry exists amongst the general public, regulators, and policy makers providing for a certain level of leeway. And Japan’s previous issue with long drug approval times (referred to as the “Japanese drug lag”) has been resolved for the most part. Against this background, the saying “Japan is the best market, US is the biggest market” emerged.
However, major debate has sparked around market expansion-related repricing being introduced in 2016 that will affect novel and innovative pharmaceutical products. Within this repricing system, post-market annual sales that significantly exceed manufacturer estimated sales will be subject to a price reduction of up to 50%. Also referred to as “the repricing rule for huge-seller drugs,” this system was developed following the 2015 market release of the drug to treat Hepatitis C virus (HCV), a ground-breaking treatment that those with HCV had been waiting several years for. However, in contrast to the 100 billion yen annual sales estimated by the manufacturer, actual annual sales estimates quickly approached 500 trillion yen. To address situations like these, government and health insurance officials viewed the introduction of a market pricing control system as the only choice. The pharmaceutical industry, on the other hand, was vehemently opposed and pleaded to have the system revised. One industry group leader commented, “A system that adds uncertainty to innovation cannot be approved. This will rob business of its ability to properly forecast.” Moving forward, new drugs and regenerative medicine products categorized as “huge-seller” drugs are likely to continue to enter the market. Alongside several other countries, Japan is now facing the question of how to best confront the dilemma of innovation and the sustainability of health care financing.
References
1 OECD. 2015. “OECD Health Data 2015.” http://www.oecd.org/els/health-systems/health-data.htm (accessed 12 November 2015).
2 Data extracted on 12 November 2015 02:36 UTC (GMT) from OECD.Stat
3 OECD. Focus on Health Spending. OECD Health Statistics 2015. p. 3 Retrieved from: http://www.oecd.org/health/health-systems/Focus-Health-Spending-2015.pdf (accessed on 30 July 2015)
4 OECD. 2015. “OECD Health Data 2015.” http://www.oecd.org/els/health-systems/health-data.htm (accessed 12 November 2015).
5 OECD. Health at a Glance 2013: Health Indicators. p.162-163. Retrieved from: http://www.oecd.org/els/health-systems/Health-at-a-Glance-2013.pdf (accessed on 10 August 2015)
6 Ikegami, N., B.-K. Yoo., Hashimoto, H., Matsumoto, M. Ogata, H., Babazono, A., Watanabe, R., Shibuya, K., B.-M. Yang, Reich, M.R. and Kobayashi, Y. Japanese universal health coverage: evolution, achievements, and challenges. The Lancet. 2011; 378: 1106–15
7 OECD. Health at a Glance 2013: Health Indicators. p.14. Retrieved from: http://www.oecd.org/els/health-systems/Health-at-a-Glance-2013.pdf (accessed on 10 August 2015)
8 Japan Generic Medicines Association, http://www.jga.gr.jp/medical/about/generic07/